NeuCube
NeuCube is a world-first development environment and a computational architecture for the creation of Brain-Like Artificial Intelligence (BLAI, pioneered by Professor Nikola Kasabov), that includes applications across domain areas. It is based on the latest neural network models, called spiking neural networks (SNN).
A software implementation of NeuCube is available in the following languages: MATLAB; JAVA; Python (PyNN); C++.
NeuCube software is available for the following computer platforms: PCs; SpiNNaker; GPUs; Cloud based platforms.
Using NeuCube
NeuCube is a generic system that needs to be tailored for particular applications, using the following steps:
- Input data transformation into spike sequences
- Mapping input variables into spiking neurons
- Deep unsupervised learning spatio-temporal spike sequences in a scalable 3D SNN reservoir
- Ongoing learning and classification of data over time
- Dynamic parameter optimisation
- Evaluating the time for predictive modelling the Brain-Like Artificial Intelligence (BLAI, pioneered by Professor Nikola Kasabov)
- Adaptation on new data, possibly in an on-line/ real time mode
- Model visualisation and interpretation for a better understanding of the data and the processes that generated it
- Implementation of a SNN model: von Neumann vs neuromorphic hardware systems
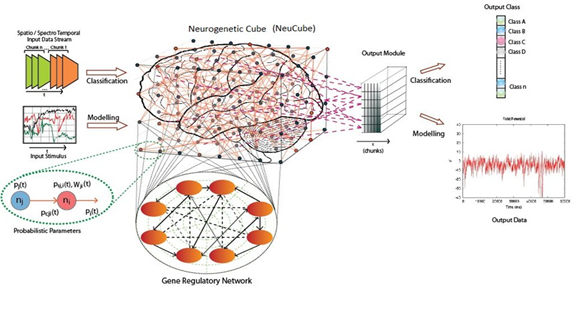
A NeuCube architecture for spatio-temporal brain data (STBD) modelling is presented below (View the paper)
Applications of NeuCube
Short article on our research
- Supplemental materials for the article “Can spiking neural networks predict earthquakes?" (Nikola Kasabov, Reggio Hartono)
Figures and animations
These animations show the training of the reservoir cube in regard to the synaptic weight change of the connections between neurons over time. Blue line indicates a positive connection, red otherwise. The thicker the line is the stronger the weight of the synapse.
The cube trained on seismicity data from 52 sites across New Zealand, from 5 days before and up to 1 hour before historical large earthquakes in Canterbury region.
The cube trained on a single earthquake in Christchurch area, from 5 days before and up to 1 hour before the actual event.
Modelling Cognition in a Brain-like Spiking Neural Network Architecture: A Case on fMRI Data
Evolution of neurons’ activation degrees and the deep learning architecture formed in the SNNcube when the subject was watching a picture.
Evolution of neurons’ activation degrees and the deep learning architecture formed in the SNNcube when the subject was reading a sentence
Modelling and Classification of FMRI data using the NeuCube Spiking Neural Network Architecture
Benchmark STAR/PLUS fMRI dataset is available at CS CMU website [1], [2]. During fMRI data acquisition, subjects were shown a picture and a sentence, and instructed to press a button to indicate whether the sentence correctly described the picture. Particular intervals of this data which are related to reading sentences (affirmative or negative sentences) were analysed using benchmark LIBSVM and the data classification results published in [3]. Similarly, I used this fMRI data for illustration of the NeuCube classification of fMRI data corresponding to different sentence polarities. The results are reported as follows:
| Method | Sessions and selected voxels for classification | C1 (affirmative) | C2 (negative) | Total |
| NeuCube | Session I: 20 voxels selected using SNR | 80% | 100% | 90% |
| Session II: 20 pre-selected voxels from RDLPFC region | 90% | 80% | 85% | |
| Session III: 20 pre-selected voxels from LDLPFC region | 90% | 80% | 85% | |
| SVM [3] | Session I: classification based on the LDLPFC’s voxels | 64% | 68% | 66% |
| classification based on the RDLPFC’s voxels | 65% | 69% | 67% |
The feasibility analysis of the NeuCube architecture is not only limited to a higher classification accuracy, but a better visualisation and interpretation of the SNN models trained on the fMRI data as shown in Fig. 1. NeuCube platform is available free.
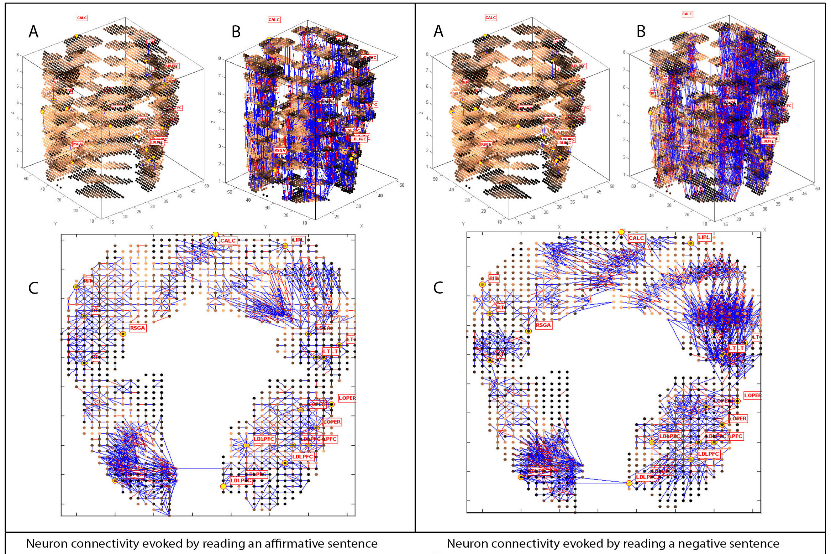
The initial (A) and final (B) connectivity of a SNNc after training with two different data sets, related correspondingly to: affirmative sentence versus negative sentence. The final connectivity is also shown as a 2D projection (C). Positive connections are shown in blue and negative – in red.
References
- M. Just, “StarPlus fMRI data,” [Online]. Available: http://www.cs.cmu.edu/afs/cs.cmu.edu/project/theo-81/www/. [Accessed 13 07 2014].
- F. Pereira, “E-print Network,” 13 02 2002. [Online]. Available: http://www.osti.gov/eprints/topicpages/documents/record/181/3791737.html. [Accessed 2014 07 13].
- M. Behroozi and M. R. Daliri, “RDLPFC area of the brain encodes sentence polarity: a study using fMRI,” Brain imaging and behavior, pp. 1-12, 2014.
In New Zealand, stroke has become the third leading cause of death after cancer and heart disease, and it is the greatest cause of disability in older people [2]. Each year it is predicted that over 7,000 New Zealanders will experience a stroke event, and of this population at least three-quarters will die or be dependent on others for care one year after the event [3]. Health costs associated with stroke both to individuals and the health system is high and increasing. When severe, stroke has a substantial impact on the psychological and physical well-being of both patients and their families [4].
It is often observed that individuals with similar medical risk factors suffer a stroke at different time points to each other. It has been suggested that the external environment plays a significant role as a trigger of stroke. Moving toward personalized preventive measures, in this study we apply an individualized approach to stroke risk assessment using NeuCube SNN architecture in Figure 1. The first objective of this study is to verify that the increment of stroke risk in an individual with modifiable risk factors for stroke is triggered by a combination of environmental factors. Secondly, to understand the association of combined environmental variables toward a stroke event on individual level of risk. Thirdly, exploring the influence of prolonged exposure to inclement environmental conditions several days before a stroke event that can help us determine the earliest time point at which we can best predict the risk of stroke incident in individuals.
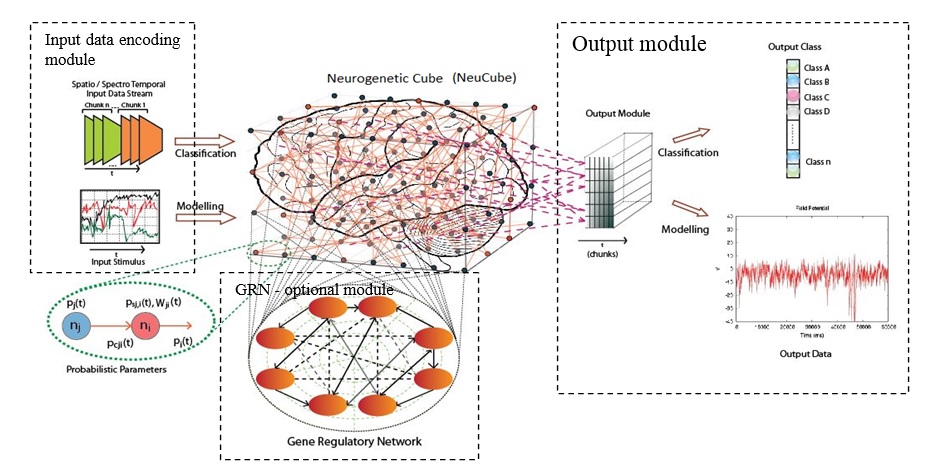
A functional diagram of the NeuCube SNN architecture, consisting of: Input data encoding module; 3D SNN Neurogenetic cube using STDP learning rule; Output module for classification or regression using RO and STDP learning rules; Gene regulatory network (GRN) module (optional) [5]
Dataset
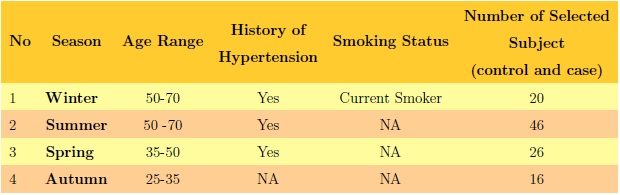
The dataset consists of 2805 samples (all with first-ever occurrence of stroke) taken from the Auckland Regional Community Stroke Study (ARCOS) population. This data set has been published in several studies where they apply different methods to the case study, for example statistical methods [6], FaLK-SVM (global method) [7], and a combination of evolving personalized method (evoPM) with gravitational search algorithm and recurrent reservoir [8]. In exploring the feasibility of NeuCube M1 (system) for predictive modelling of SSTD this study has been published recently in 2014 International Joint Conference on Neural Network (IJCNN) [9]. The third ARCOS study was chosen which is between 2002 and 2003, consisting of 1207 subjects. These subjects were then divided into several subgroups stratified by season (summer, autumn, winter, spring), history of hypertension, smoking status and age to explore the susceptibility of groups to the influence of environmental changes (see Table 1). Each subject is described by 12 environmental variables (wind speed, wind chills, temperature dry, temperature wet, temperature max, temperature min, humidity, atmospheric pressure, nitrogen dioxide, sulphur dioxide, ozone gas, solar radiation) measured daily within a time window before the stroke event, we created personalised models of 108 individuals using the NeuCube SNN architecture from Figure 1.
Stroke Occurrences Dataset
Since the data consists only of stroke subjects, the time window between days 60 and 40 before the event was used as ‘low risk’ and the days between 20 and 1 days before the event as high risk (see Figure 2).
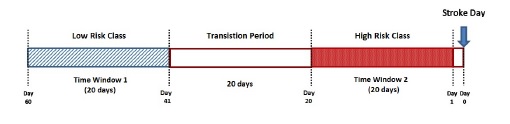
Time windows to discriminate between ‘low risk’ and ‘high risk’ stroke class
Revealing dynamic triggering patterns
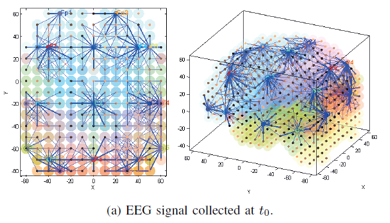
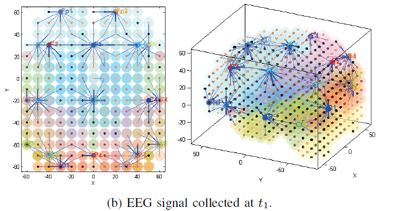
A personalised SNN model can be used to reveal dynamic patterns of consecutive changes in the environmental variables over time that would represent meaningful, predictive triggering patterns for an individual (see Figure 3). Figure 3 suggests that consecutive changes of input variables, represented as trajectories of spiking activities of neurons in the SNN cube, would have an impact on a stroke risk.
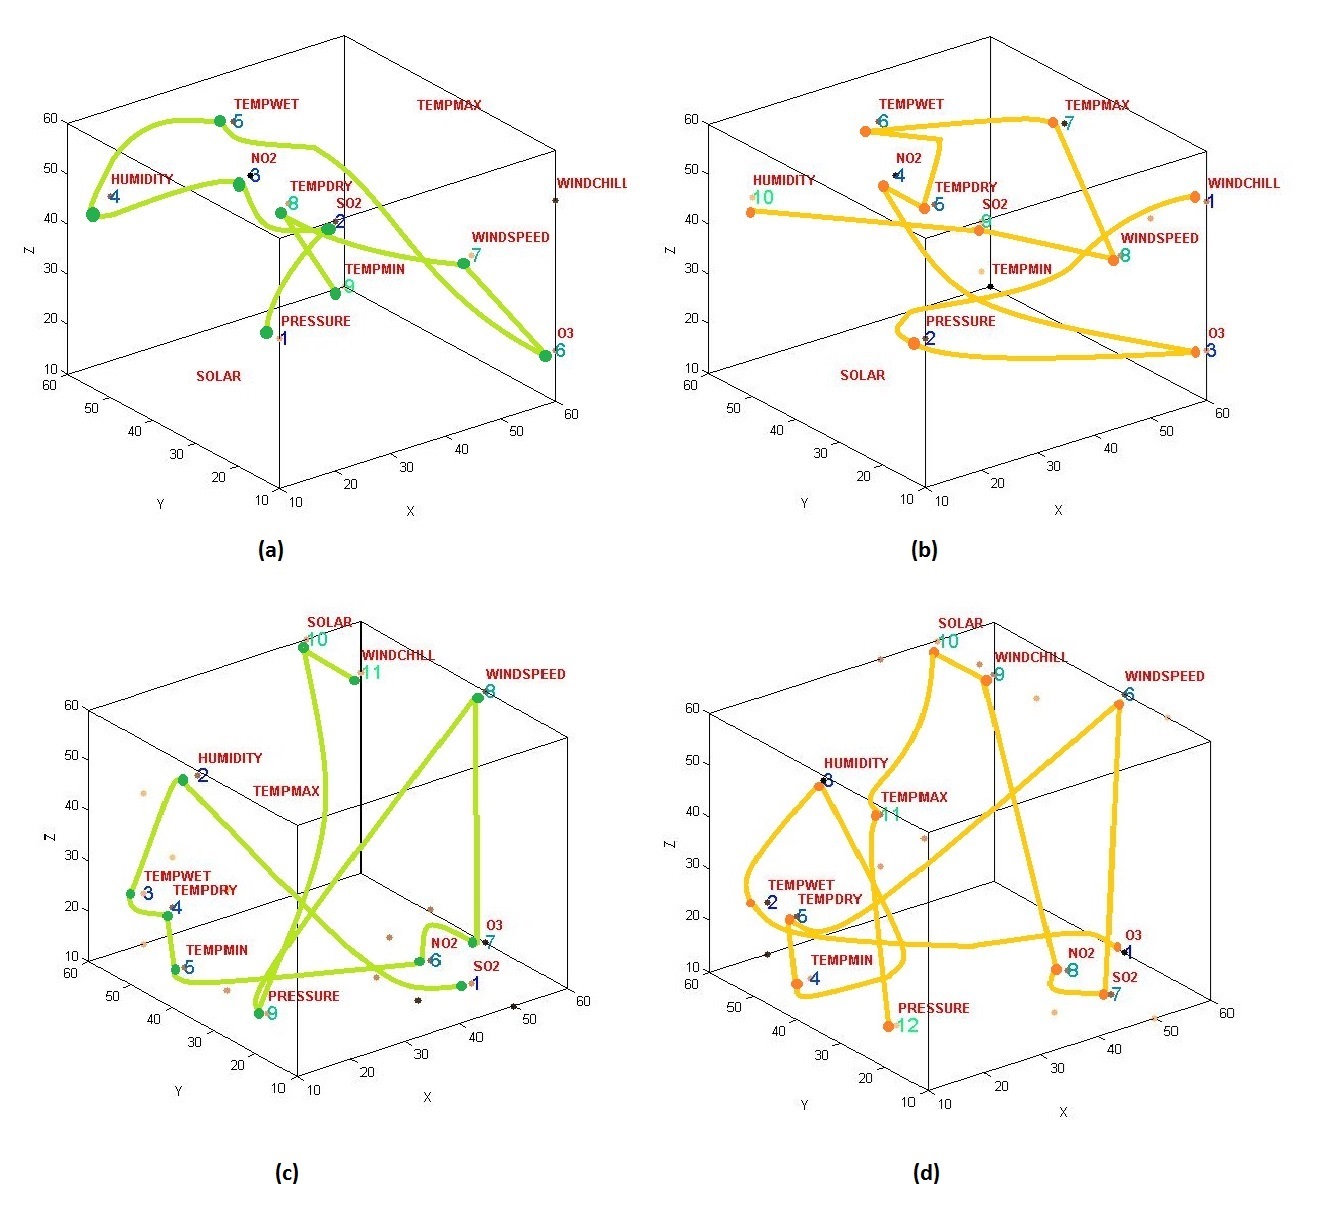
Revealing dynamic temporal patterns as trajectories of major consecutive changes in the environmental variables presented as a temporal order from 1 to 10, related to Low Risk and High Risk of stroke prediction for two selected individuals: Subject 20 in the summer season - (a) low risk trajectory pattern, (b) high risk trajectory pattern; Subject 1 in the spring season - (c) low risk trajectory pattern, (d) high risk trajectory pattern.
Seasonal variation analysis [1]
It could be argued that each season forms a different population grouping due to its different environmental conditions. To determine whether any differences were significant or not a two sample t-test with unequal variances was carried out. Using this t-test with all variant couplings of seasons, it was found that it is possible to group the seasons into two separate populations, see Table 2. As can be seen from Table 3, seasonal comparisons outside these groupings did show a statistically significant difference in population means, with an alpha value of 0.05.
When comparing the standard deviation of the environmental data within each season autumn showed the largest value at 4.19, see Table 4. This indicates that there is a greater level of variation within the data in this season than in any of the others, which may in turn affect the model built upon this data and its accuracy of prediction.
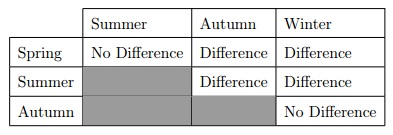
Results of t-test for significant difference between seasonal groups
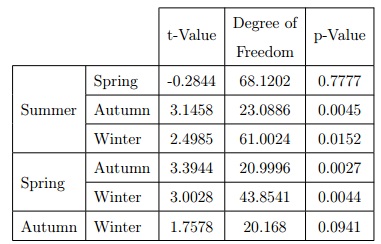
Two sample t-test with unequal population variances
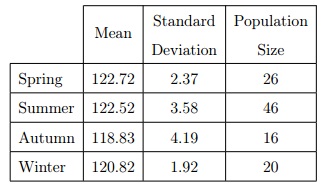
Mean and standard deviation for environmental data within each season
Conclusion
The novelty of this research is in proving there are hidden associations amongst the environmental features that increase the risk of stroke for an individual. This research has successfully achieved the objectives by predicting accurately the risk of stroke occurrences at the earliest time point at 6 days prior, and demonstrates that analysing all the features collectively can accurately predict stroke risk. We also confirmed that there is a cascading effect unique for each individual depending on their exposure to certain environmental factors within a specific time window.
References
- Othman, M. Spatial-temporal data modelling and processing for personalised decision support (Doctoral dissertation, Auckland University of Technology). 2015. (http://hdl.handle.net/10292/9079 )
- Martin Tobias, Jit Cheung and Harry McNaughton. Modelling stroke: a multi-state life table model. Ministry of Health, 2002.
- John Gommans, Alan Barber, Harry McNaughton, Carl Hanger, Patricia Bennett, David Spriggs and Jonathan Baskett. Stroke rehabilitation services in New Zealand. The New Zealand Medical Journal, vol. 116, no. 1174, pages U435–U435, 2003.
- Maree L Hackett, John R Duncan, Craig S Anderson, Joanna B Broad and Ruth Bonita. Health-related quality of life among long-term survivors of stroke results from the Auckland stroke study, 1991–1992. Stroke, vol. 31, no. 2, pages 440–447, 2000.
- Nikola K Kasabov. NeuCube: A spiking neural network architecture for mapping, learning and understanding of spatio-temporal brain data. Neural Networks, vol. 52, pages 62–76, 2014.
- Craig S Anderson, Kristie N Carter, Maree L Hackett, Valery Feigin, P Alan Barber, Joanna B Broad, Ruth Bonitaet al. Trends in stroke incidence in Auckland, New Zealand, during 1981 to 2003. Stroke, vol. 36, no. 10, pages 2087–2093, 2005.
- Wen Liang, Yingjie Hu, Nikola Kasabov and Valery Feigin. Exploring associations between changes in ambient temperature and stroke occurrence: comparative analysis using global and personalised modelling approaches. In Neural Information Processing, pages 129–137. Springer, 2011.
- Nikola Kasabov, Valery Feigin, Zeng-Guang Hou, Yixiong Chen, Linda Liang, Rita Krishnamurthi, Muhaini Othman and Priya Parmar.Evolving spiking neural networks for personalised modelling, classification and prediction of spatio-temporal patterns with a case study on stroke. Neurocomputing, vol. 134, pages 269–279, 2014.
- Muhaini Othman, Nikola Kasabov, Enmei Tu, Valery Feigin, Rita Krishnamurthi, Zhengguang Hou, Yixiong Chen and Jin Hu. Improved predictive personalized modelling with the use of Spiking Neural Network system and a case study on stroke occurrences data. In Neural Networks (IJCNN), 2014 International Joint Conference on, pages 3197–3204. IEEE, 2014. (http://ieeexplore.ieee.org/xpls/abs_all.jsp?arnumber=6889709&tag=1 )
Supplementary material
Experiments were performed on the publicly available FGNET. The lack of a large face aging database until recently, limited research on age invariant face recognition. There are two desired attributes of a face aging database: (i) large number of subjects, and (ii) large number of face images per subject captured at many different ages. In addition, it is desired that these images should not have large variations in pose, expression, and illumination. The MORPH dataset has a large number of subjects while FGNET database has a large number of images. MORPH dataset contains about 55,000 face images from 13,000 different people. The FGNET database contains 1002 color and gray face images of 82 persons across a range of different ethnicities. There is a large variation in lighting, expression and pose across the different images. The image size is 300 x 400 in pixel units, on the average. The ages vary from 0 to 69 years. There are on the average, 12 images per person across different ages.
Experiment
For this experiment we distribute the FG-NET Database into three age subspaces as 0-15, 16-30 and 31 - 69. We take a sample size that has a time length of 10 divisions. We then choose 12 samples from each subspace. Thus we take 120 images from subspace 1 and assign them as class 1. Similarly, we choose 120 images from subspace 2 and assign them as class 2 and do the same for subspace 3. For each of the images we take 7 Anthropometric features. Each sample provides a 10x7 matrix i.e. 10 images, with each having 7 features. In all, there are 36 samples. The results of this experiment is given below.
| Measure | NeuCube | MLP | SVM | Naïve Baye |
| Accuracy(%) | 81.50 | 63.30 | 53.0.3 | 55.60 |
The Progression of Alzheimer Disorder
Motivated by the dramatic rise of neurological disorders, we proposed an SNN technique to model electroencephalography (EEG) data collected from people affected by Alzheimer’s Disease (AD) and people diagnosed with mild cognitive impairment (MCI). An evolving spatio-temporal data machine (eSTDM), named the NeuCube architecture, is used to analyse changes of neural activity across different brain regions. The model developed allows for studying AD progression and finding whether the MCI patient is likely to be developed as AD over the time. This model also enabled us to have precise analysis about brain activates across EEG band-frequencies (Alpha, Beta, theta and Delta). Using the NeuCube SNN-based visualization, we can obtain a better understanding and interpretation of the physiological brain ageing of AD patients.
Neurocomputational EEG Analysis on Perception and Production of Facial Expressions
We used the NeuCube architecture of SNN for mapping, learning and visualisation of EEG data recorded from subjects when they were performing a facial expression-related task. Using the NeuCube, as a potential spatiotemporal data machine, enables us for the first time, to study the level of variation between perceiving versus mimicking facial expressions. Also the visualization of the SNN models trained on the EEG data proves the mirror neurons principle in the brain. We identified that role of mirror neurons can be dominant in sadness emotion, compared with the other emotions.
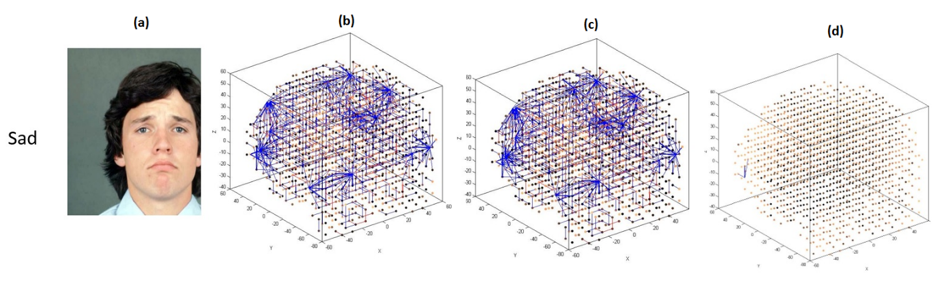
Exposing the facial expressions on screen (b) Connectivity of a SNNc trained on EEG data related to perceiving the sadness emotion image (c) Connectivity of a SNNc trained on EEG related to mimicking the sadness emotion image (d) subtraction between perceiving and mimicking emotions to visualise the differences between SNNc of (a) and (b)
Publications, patents and benchmarking
The proposed NeuCube framework and computational architecture enable the creation of intelligent systems, that when compared with traditional statistical and machine learning methods, showed superior results in the following aspects: 1) Better data analysis and classification/regression accuracy (by 10 to 40%); 2) Better visualisation of the created models, with a possible use of VR; 3) Better understanding of the data and the processes that are measured; 4) Enabling new information and knowledge discovery through meaningful interpretation of the models.
Description of the NeuCube with selected applications is published in the following papers:
- N.Kasabov, V.Feigin, Z.Hou, Y.Chen, Improved method and system for predicting outcomes based on spatio/spectro-temporal data, PCT patent WO2015/030606 A2, US2016/0210552 A1. Granted/Publication date: 21 July 2016.
- Kasabov, N. NeuCube: A Spiking Neural Network Architecture for Mapping, Learning and Understanding of Spatio-Temporal Brain Data, Neural Networks vol.52 (2014), pp. 62-76, http://dx.doi.org/10.1016/j.neunet.2014.01.006
- Nikola Kasabov, Nathan Matthew Scott, Enmei Tu, Stefan Marks,Neelava Sengupta, Elisa Capecci, Muhaini Othman, Maryam Gholami Doborjeh, Norhanifah Murli, Reggio Hartono, Josafath Israel Espinosa-Ramos, Lei Zhou, Fahad Bashir Alvi, Grace Wang, Denise Taylor, Valery Feigin, Sergei Gulyaev, Mahmoud Mahmoud, Zeng-Guang Hou, Jie Yang (2015) Evolving Spatio-Temporal Data Machines Based on the NeuCube Neuromorphic Framework:Design Methodology and Selected Applications. Neural Networks Journal, Special Issue on Neural Network Learning in Big Data, 2015, Elsevi
- N.Kasabov, From Multilayer Perceptrons and Neuro-Fuzzy Systems to Deep Learning Machines: Which Method to Use? – A Survey, Int. Journal on Information Technologies and Security, vol.9, No. 20, 2017, 3-24.
- N.Sengupta, N. Kasabov, Spike-time encoding as a data compression technique for pattern recognition of temporal data, Information Sciences 406–407 (2017) 133–145.
R&D system
The NeuCube development system in its different software and platform implementations is available subject to licensing agreement.
NeuCube Cloud
We are developing a cloud-based NeuCube system with on-demand compute to train Spiking Neural Network models.
Spiking Neural Networks - Encoding Optimization Tools
A spike encoding tools for temporal data input to a spiking neural network.